
How to use this documentation
Use this page as an end-user workflow guide. It explains who should use the page, what setup is needed, what steps to follow, what fields matter, and what to check when something looks wrong.
Who should use it
Before you start
- The user has permission for the report they want to open.
- Source data exists for the selected period.
- The user understands whether the report expects a date range, month/year, or employee filter.
Step-by-step workflow
- 1
Choose the report
Open Reading Monthly, Attendance, Fuel, or Profits based on the question being reviewed.
- 2
Set filters
Select date range, month, year, or employee where the report asks for it.
- 3
Generate the result
Tap Generate Report or the equivalent action before reading rows, charts, totals, or details.
- 4
Expand or open details
Use expanded rows, date details, or report tabs to inspect the values behind the summary.
- 5
Reconcile with source workflows
When a number looks wrong, compare it with shift check-in, current shift, DSR, invoices, attendance, or fuel data.
Important fields
Reading Monthly
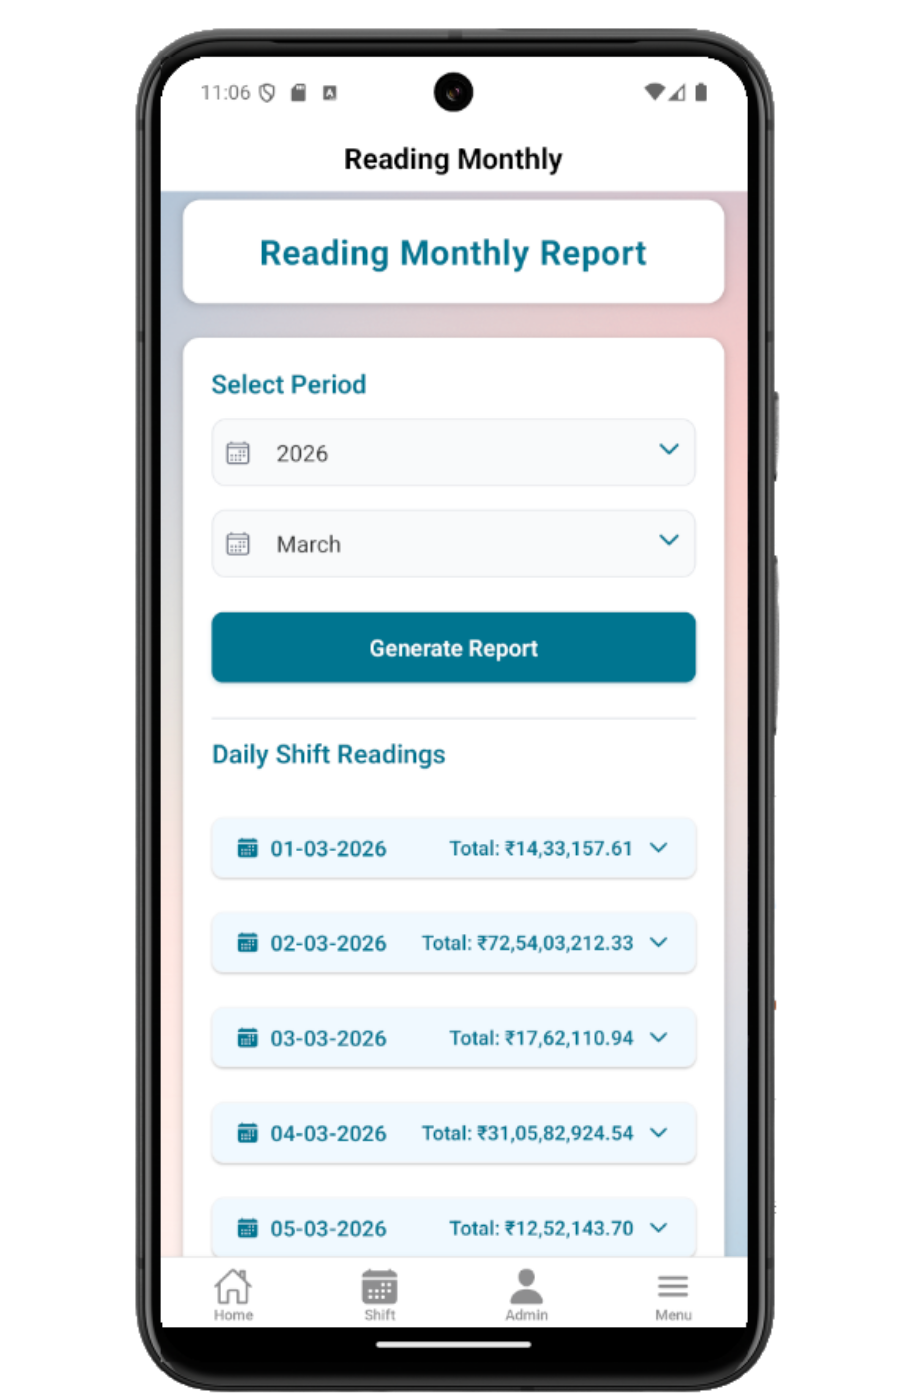
Month and year report for daily shift readings and fuel totals.
Attendance
Report and calendar views for employee presence, sales, or tanker kilometres.
Fuel
Datewise and monthly views with amount, litres, totals, and charts.
Profits
Date range report for revenue, cost, and profit or loss by fuel type.
Common mistakes
- Comparing report totals without matching date filters.
- Treating chart values as corrections instead of reviewing source entries.
- Expecting reports without the required permission.
- Creating separate docs for every small report tab instead of using the grouped report guide.
Troubleshooting
A report is missing.
Check report permissions and whether the role should have access to that report.
Report rows are empty.
Check filters and confirm source entries exist for the selected period.
Profit details do not open.
Generate the report first, then tap a date row to open details.
Related documentation
Web dashboard docs
Mobile app equivalents
- Mobile Daily Sales Report
- Mobile Attendance
- Mobile Current Shift
Screenshot note
- Uses mobileApp9 from the existing static mobile screenshot set.
Use Reading Monthly for shift reading history
Reading Monthly uses month and year filters, groups data by date, and expands daily shift readings with fuel-wise sales totals.
Use Attendance for staff review
Attendance includes report and calendar views. It helps users review employee attendance, sales amount, or tanker kilometres depending on role and permission.
Use Fuel reports for sales and litres
Fuel reports include datewise and monthly views. They show product, amount, litres, totals, and chart distribution for the selected period.
Use Profit reports for owner review
Profit reports use a date range and show revenue, cost, and profit or loss by fuel type. Users can open date details for a closer breakdown.
Check filters before comparing numbers
Report totals depend on date range, month, year, fuel type, employee, and permission context. Always confirm filters before comparing with web or paper records.
Mobile reports checklist
How Petrodweep supports mobile reports
- Petrodweep groups mobile reports by practical user intent rather than publishing one thin page for each report tab.
- Reading Monthly, Attendance, Fuel, and Profit reports reuse similar date and period filter patterns.
- Report details guide users back to shift, DSR, and attendance source workflows when numbers need correction.
Frequently asked questions
Why is a report missing from my mobile app?
Check your report permissions and role. Some reports are visible only to roles with the required access.
Why do mobile report totals differ from what I expected?
Confirm filters first, then compare with source entries such as shift readings, DSR rows, attendance, invoices, or fuel data.
Should each mobile report tab have its own page?
No. A grouped overview is clearer for users and avoids thin SEO pages.